So you’ve been a good software developer and you’ve written unit tests for your Java code. But have you tested everything? Is there a part of your code that hasn’t been covered by your test suite? There’s an easy way to find out. Simply embed a code coverage report into your build. Today, we’ll see how to integrate the JaCoCo code coverage tool into our reports!
Introduction
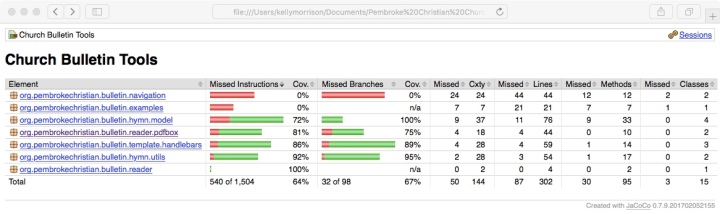
A code coverage tool executes a test suite and determines which lines of the source code have been executed and which have not. A commonly used library for providing code coverage for Java is the JaCoCo (Java Code Coverage) library. When you integrate the library into your build and run your unit tests, JaCoCo tracks the lines that were executed. These results can then be displayed in the Eclipse IDE (using the EclEmma plugin) or in the site documentation generated by Maven. Here is an example of a JaCoCo coverage report:
A JaCoCo code coverage report.
As we can see, the code coverage report shows the various packages in the project. For each package, the number of executed and missed instructions is shown (e.g., 81% means that 81% of the instructions in the package were executed by the unit tests). The number of missed branches is also shown: if there is an if-then-else statement and only one of the branches is executed by the unit tests, then there is a missed branch. For this project, we can see that 64% of the instructions were executed by the test suite, and 67% of the branches in the code were executed. We can also drill down into the packages to look at individual classes.
Adding JaCoCo reports to your site documentation
Let’s see how to create a code coverage report. We can use the JaCoCo Maven plugin to create the report when we generate our site documentation. This plugin is slightly more complicated to configure than the previous plugins we have used. We need to specify it in two places in our pom.xml file:
<project>
  <build>
    <plugins>
      <!-- First part of the configuration goes here. -->
    </plugins>
  </build>
  <reporting>
    <plugins>
      <!-- Second part of the configuration goes here. -->
    </plugins>
  </reporting>
</project>
The first part of the configuration is rather long. It looks like this:
<plugin> <groupId>org.jacoco</groupId> <artifactId>jacoco-maven-plugin</artifactId> <version>0.7.9</version> <executions> <execution> <id>default-prepare-agent</id> <goals> <goal>prepare-agent</goal> </goals> </execution> <execution> <id>default-report</id> <phase>prepare-package</phase> <goals> <goal>report</goal> </goals> </execution> <execution> <id>default-check</id> <goals> <goal>check</goal> </goals> <configuration> <rules>
<!-- implementation is needed only for Maven 2 -->
<ruleimplementation="org.jacoco.maven.RuleConfiguration"> <element>BUNDLE</element> <limits>
<!-- implementation is needed only for Maven 2 -->
<limitimplementation="org.jacoco.report.check.Limit"> <counter>COMPLEXITY</counter> <value>COVEREDRATIO</value> <minimum>0.60</minimum> </limit> </limits> </rule> </rules> </configuration> </execution> </executions></plugin>
The second part of the configuration is much shorter. It looks like this:
Once we have added these plugin descriptions, save the pom.xml file and generate the code coverage report like this:
$ mvn clean package site
Load the index.html file from the target/site directory into a browser. Then, under Project Reports, we should see a JaCoCo link:
The JaCoCo report now appears under Project Reports.
Clicking on that link will bring up the code coverage report for the project. We can drill down and see what instructions were executed in a particular class. For example, here is what the App.java class looks like:
Code coverage for the App.java class.
We have not yet written any unit tests for this class, so the source code lines are highlighted in red, indicating that they have not been executed. If the lines had been executed, they would be highlighted in green. The red diamonds by the conditional statements indicate that the branches were not executed.
Now that we’ve seen how to get a code coverage report, add this to one of your projects and give it a try!
In a previous series, we looked at how to use the static code analysis tool PMD to look for issues in our Java code. Today, we’ll see how to add a PMD report to our site documentation using Maven, and we will also add a source code cross reference.
Review
In the previous posts in this series, we saw that we can configure Maven to add additional reports to our documentation when we run the mvn clean package site command from the command line. We can specify the reports in the reporting section of the Maven pom.xml file:
<projectxmlns="http://maven.apache.org/POM/4.0.0"
xmlns:xsi="http://www.w3.org/2001/XMLSchema-instance"
xsi:schemaLocation="http://maven.apache.org/POM/4.0.0
http://maven.apache.org/maven-v4_0_0.xsd"><!-- Dependencies, etc. --><reporting>
<plugins>
<plugin><!-- REPORT PLUGIN DETAILS GO HERE --></plugin><plugin><!-- REPORT PLUGIN DETAILS GO HERE --></plugin>
</plugins>
</reporting></project>
Generating a source code cross reference
Before we look at adding a PMD report to our documentation, we will see how to add a source code cross reference that PMD can use. All we have to do is add the Maven JXR plugin to the reporting section. It looks like this:
Add this plugin to the reporting section of the pom.xml file and regenerate the site documentation using this Maven command:
$ mvn clean package site
Then, when we load the index.html file from the target/site directory into a browser, we can see the cross reference listings under Project Reports:
The cross reference reports.
The Source Xref report shows a cross referenced version of our Java source code, and the Test Source Xref report shows a cross referenced version of our Java test code. Here is what the Source Xref report looks like for our sample project:
The source code cross reference.
As you can see, we have a nice report that shows the packages and classes in our project. Clicking on a class will bring up a formatted version of the source code with line numbers for that class. We can also click on the Javadoc link to see the Javadoc documentation for the class, if it exists (which it currently does not: we will see how to add this in a later blog post).
Now that we have a source code cross reference, let’s add a PMD report that makes use of it!
Let’s take a look at it. After the standard Maven plugin identification information (groupId, artifactId, and version), we can see an additional item called configuration.
The configuration section allows us to configure the plugin to our liking. If we set the linkXref item to true, then the plugin will generate links in the PMD report to the source code cross reference that we generated. The targetJdk property is used to tell PMD what version of Java to use when it parses the Java source code to generate its report. We are using Java 8, so we specify 1.8 for the JDK version. The skipEmptyReport property is used to determine whether to show the report in the site documentation if no issues were found. I prefer to set this value to false so that a link to the empty report is always generated: this lets us know that the report was actually generated. Finally, the minimumTokens value is used to tell PMD how much code needs to be duplicated before deciding that a piece of code is a duplicate. The default value of 100 corresponds to about 5 to 10 lines of source code.
After adding this plugin to the reporting section and regenerating the documentation with the mvn clean package site command, we can see that two new reports appear under Project Reports: CPD and PMD.
The PMD and CPD reports.
Let’s look at the PMD report first. If we click on PMD, we can see the issues that PMD detected in our code:
Issues that PMD detected in our source code.
We can see that PMD detected an unused variable in the App.java file, and it also noticed that we used a floating point variable as a loop index. If we click on the line number on the right, it will take us to the source code cross reference and show us the line where the error occurred.
Now, let’s look at the Copy/Paste Detector (CPD) report. This report shows us instances of duplicated code in our project that may have been copied and pasted from one place to another. Our existing project does not have any duplicated code, so the report is empty. Let’s add some duplicate code to see what the report would look like. Bring up the App.java file in a text editor and add the following horrendous function (with a repeated nested loop) to it:
publicint f1() {
intsum = 0;
for (inti = 0; i < 100; i++) {
for (intj = 0; j < 100; j++) {
for (intk = 0; k < 50; k++) {
if (i != j) {
sum += i - j;
} elseif ((i -j == 0)) {
sum += j = i;
} else {
sum += 5;
}
}
}
}
for (inti = 0; i < 100; i++) {
for (intj = 0; j < 100; j++) {
for (intk = 0; k < 50; k++) {
if (i != j) {
sum += i - j;
} elseif ((i -j == 0)) {
sum += j = i;
} else {
sum += 5;
}
}
}
}
return sum;
}
Now, when we generate our report, the CPD report… is still empty. The triply nested loop of code was not long enough to trigger the copy/paste detector. Bring up the pom.xml file and change the minimumTokens value from 100 to a lower value (we’ll use 70). Save the pom.xml file and regenerate the report. This time, the CPD report shows us the code duplication:
Uh oh: we found some duplicated code!
The report shows the piece of code that was duplicated, and it provides links to the source code for the two locations where the duplicate code was found. Very nice!
Try adding the source code cross reference, PMD, and CPD reports to your project. You might be surprised what you find!
Today, we will learn how to integrate the static code analysis tool FindBugs into our Maven project to look for errors in our Java code. We will also see how to integrate two third party FindBugs libraries to look for additional issues with our code, such as security problems.
FindBugs
The FindBugs tool was developed by Bill Pugh and David Hovemeyer in 2006 to detect potential bugs in Java code by examining Java bytecode. The open source project has been actively maintained over the years, with the latest release (3.0.1) supporting Java 8. The tool may be run as a standalone command line tool, from an IDE using a plugin, or from tools such as Jenkins and Maven. There are also several third party extensions for FindBugs.
Integrating FindBugs into Maven
Let’s see how to add FindBugs to our Maven project so that it generates a report about our Java code when we generate our site documentation. We can use the Maven FindBugs plugin to do this.
The Maven FindBugs plugin is configured in the <reporting> section of our pom.xml file. As we saw in the previous post in this series, the <reporting> section looks like this:
<projectxmlns="http://maven.apache.org/POM/4.0.0"
xmlns:xsi="http://www.w3.org/2001/XMLSchema-instance"
xsi:schemaLocation="http://maven.apache.org/POM/4.0.0
http://maven.apache.org/maven-v4_0_0.xsd"><!-- Dependencies, etc. --><reporting>
<plugins>
<plugin><!-- report plugin details go here --></plugin><plugin><!-- report plugin details go here --></plugin>
</plugins>
</reporting></project>
Adding the FindBugs plugin is a simple matter of inserting the plugin into the <reporting> section:
Save the pom.xml file and regenerate the site documentation. Notice that we add package to the goals on the command line: this is necessary to compile the code so that FindBugs may operate on the generated bytecode.
$ mvn clean package site
Now, load the index.html page from the target/site directory into a web browser. Under Project Reports, we see a FindBugs report appear:
The FindBugs report.
If FindBugs detected any issues in our code, they would be reported here. Our sample project doesn’t have any bugs, so the report is empty. Let’s add a bug to our code to see what it would look like in the report. Open the src/main/java/com/softwareriot/App.java file and add the following lines into the main() routine:
publicstaticvoid main(String[] args) {
// --- Intentionally bad code begins here String x = null; String y = x.substring(3);// --- Intentionally bad code ends here
System.out.println("Hello World!");
}
Now, regenerate the site documentation:
$ mvn clean package site
Reload the target/site/index.html page and go to the FindBugs report:
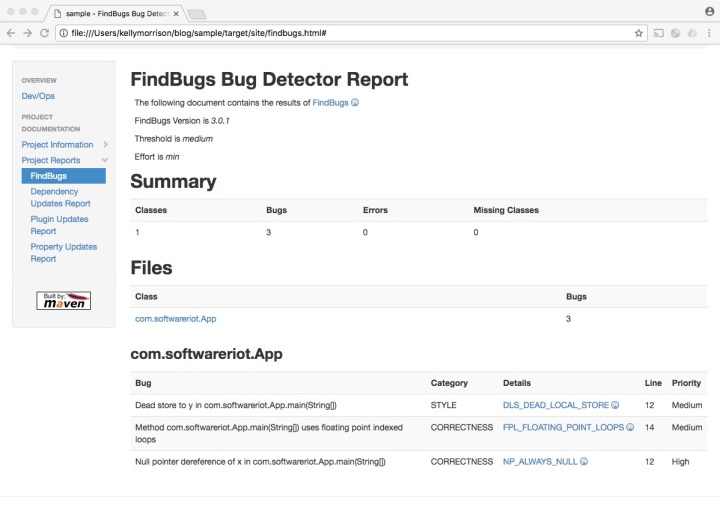
The FindBugs report, now reporting errors.
Ta-dah! FindBugs detected two issues with the code. It noticed that we never used the second string after declaring it, and it saw a null pointer exception that would be generated if the code was executed. It provided the line number in the source file for each error, and it provided a link to further details about the error.
The fb-contrib extensions
A popular third party plugin library for FindBugs is called fb-contrib. It adds a number of new detectors to find more issues in Java source code. To use it in Maven, we simply add it to the findbugs-maven-plugin description as a <configuration> item:
Now, let’s add another intentional error to our src/main/java/com/softwareriot/App.java file for the fb-contrib library to detect.
// --- Intentionally bad code begins here
String x = null;
String y = x.substring(3);
// -- The fb-contrib library should flag the following line:for (floatf = 1.0f; f <= 10.0f; f += 0.1f) { System.out.println(f); }
// --- Intentionally bad code ends here
This loop uses a floating point variable as a loop index, which can cause issues as floating point arithmetic can be imprecise. Save the code, and regenerate the documentation:
$ mvn clean package site
Reload the target/site/index.html page in a browser and look at the FindBugs report:
The FindBugs report with an fb-contrib error.
We can now see the error detected by the fb-contrib library. However, there is a flaw with the page: if we click on the Details link for the fb-contrib error, it takes us to the standard FindBugs error descriptions instead of the fb-contrib error descriptions. This is something to be aware of when publishing these reports for others to see.
FindBugs Security Library
Finally, let’s look at one more plugin library for FindBugs: the FindBugs Security Library. This is a third party library that looks for security issues in Java code.
To configure the plugin, we add it to the findbugs-maven-plugin description as we did for the fb-contrib plugin:
Now, let’s add a security bug to our code. Open up the App.java file and add the following lines inside the main() method. This code uses the weak SHA-1 algorithm for hashing a password.
Save the App.java file and regenerate the documentation:
$ mvn clean package site
Finally, open up the index.html file in the target/site directory and click on the FindBugs report. We can now see that FindBugs reports a security warning on the use of the SHA-1 cryptographic routines.
FindBugs showing a security warning.
Try running FindBugs with these two plugin libraries on your own code and see what you find!
Wouldn’t it be nice to get a report that shows which of the third party libraries in your Java project have updates available when you perform a build? Today, we will look at a Maven plugin that makes it possible to do just that.
Getting started
Maven provides a means of generating reports for a project by configuring them in a <reporting> section in the Maven pom file. A report may be created by adding the plugin that generates the report to the <reporting> section. Here is a sample pom file that shows the general layout:
<projectxmlns="http://maven.apache.org/POM/4.0.0"
xmlns:xsi="http://www.w3.org/2001/XMLSchema-instance"
xsi:schemaLocation="http://maven.apache.org/POM/4.0.0
http://maven.apache.org/maven-v4_0_0.xsd"><!-- Dependencies, etc. --><reporting>
<plugins>
<plugin><!-- report plugin details go here --></plugin><plugin><!-- report plugin details go here --></plugin>
</plugins>
</reporting></project>
Checking for outdated libraries
Now that we’ve seen where to add reports in our pom file, let’s add one! The versions-maven-plugin will generate reports that show which of the third party libraries and Maven plugins in our project are out-of-date. To use it, just add the plugin to the <reporting> section of our pom.xml file:
The <reportSets> portion of this plugin is interesting: this is where we can specify which report(s) we wish to run on our project. The first report, dependency-updates-report, will check all of the third party libraries in the project (e.g., JUnit, Guava, Hibernate, etc.) to see if there is a new version available. The second report, plugin-updates-report, will check the Maven plugins in the pom file to see if there is a more recent version available. The last report, property-updates-report, will check any artifacts where the version number is specified inside the pom file using a Maven property. For example, we could have specified the version of Google’s guava library using a property:
Then, the property-updates-report will check any dependencies whose version is specified using a Maven property.
To run the reports, save the changes to the pom.xml file and regenerate the site documentation:
$ mvn clean site
When Maven finishes running, load the index.html file in the target/site directory in a browser and click on Project Reports:
The dependency update reports.
Under Project Reports, we can see the three reports that were generated by the versions plugin. If we click on Dependency Updates Report, we can see the third party libraries that are out of date.
Out of date dependencies.
For our sample project, we can see that we are using the outdated version 21.0 of the guava library, with version 22.0 being available. Also, we are using JUnit 3.8.1 when there is a 4.0 version available.
If we click on the Plugin Updates Report, we can see the Maven plugins in our pom.xml file that are out of date:
Outdated plugins.
Here, we can see that there are quite a few Maven plugins that are out of date in our sample project, such as the maven-antrun-plugin and the maven-assembly-plugin. The report shows the version we are using, as well as the next incremental, minor, and major versions that are available.
The last report shows which dependencies are out of date where the version number was specified by a Maven property (such as the guava version property we used earlier):
The property updates report.
In our next post, we will add reports to perform static code analysis on our project. Stay tuned!
Now that Hurricane Irma has passed by, we continue our discussion of improving a project’s documentation using Maven. Today, we will look at adding documentation written using the Markdown markup language. If you haven’t used Markdown before, it is a simple means of marking up plain text (e.g., putting text inside asterisks, such as *Markdown*, would indicate that the text should be rendered in italics: Markdown, and using two asterisks on either side, such as **Markdown**, would indicate that the text should be rendered in boldface: Markdown.)
In our previous post, we created a site descriptor for our documentation in the src/site directory. Maven allows us to add subdirectories to the src/site directory to add additional documentation. These subdirectories must be given a specific name, as specified in the Maven Doxia documentation. For example, we can include Markdown documentation by placing it in the src/site/markdown subdirectory.
Let’s try it out. Imagine that we would like to add a page to our project documentation for the Dev/Ops team that will explain how to install and configure the software. We’ll create a src/site/markdown subdirectory in our project and add a file called devops.md in that directory with the following contents:
# Dev/Ops information
## Introduction
This page tells how to install, configure,
and run the **sample** project.
The single # character indicates that we are specifying a top level header. The ## characters indicate that we are specifying a second level header. The double asterisks around the sample text indicate that it should be rendered in boldface.
Next, we regenerate the documentation for the project:
$ mvn clean site
Let’s look in the target directory to see what we got.
Notice the devops.html file? Maven created that HTML file from the src/site/markdown/devops.md file by using the Doxia tool. Let’s look at the first few lines of that file:
$ cat target/site/devops.html | head -n 10<!DOCTYPE html><!-- | Generated by Apache Maven Doxia Site Renderer 1.4 at 2017-09-13 | Rendered using Apache Maven Fluido Skin 1.5--><html xmlns="http://www.w3.org/1999/xhtml" xml:lang="en" lang="en"><head><meta charset="UTF-8" /><meta name="viewport" content="width=device-width, initial-scale=1.0" /><meta name="Date-Revision-yyyymmdd" content="20170913" />
We can see that we have an HTML5 page generated by Doxia for the Fluido skin. Nice!
Although our Markdown files have to go in the src/site/markdown directory, Maven preserves any subsequent subdirectories that might exist. For example if we have the following Markdown file:
src/site/markdown/xxx/yyy/zzz.md
and we generate the site documentation, Maven will create the following HTML file:
target/site/xxx/yyy/zzz.html
This can be extremely helpful when working on a site with a lot of documentation.
Let’s go back to our devops.md file. We’ve seen that Maven will use Doxia to create a devops.html file when we generate our site documentation, but how do we get it to appear inside our existing documentation? The answer is to add a reference to it in our site descriptor (the site.xml file that we created in the previous post). As you may recall, the site.xml file looked like this:
This will add a new menu item named Overview to the page, with a single item underneath it named Dev/Ops that links to the automatically generated devops.html page. Our site descriptor now looks like this:
This will create a simple Java project in a directory called sample. We can build the documentation for this project by running Maven with the site goal:
$ cd sample
$ mvn site
Maven will create a target directory with a subdirectory named site that contains the documentation for the project. Here is what it looks like:
The index.html file is the base file for the documentation. If we load it in a browser, it should look like this:
Project documentation created by Maven.
That looks pretty bland. Let’s see how to fix it up!
The Fluido skin
Maven allows us to specify an alternative skin when creating documentation. A popular skin is the Fluido skin that is based on the Bootstrap framework.
To use an alternative skin, we add a Maven site descriptor to our project. This is a file called site.xml that resides in the src/site directory of our project. Let’s add one:
$ lspom.xml src target$ mkdir src/site$ cd src/site$ touch site.xml
Now, open the empty site.xml file in a text editor and add the following:
This minimal site descriptor tells Maven to download the Fluido skin and use it to generate the documentation for the project. Let’s try it out. Save the site.xml file, go back to the top level directory of our project, and recreate the documentation. We will add the clean goal to ensure that we begin with a blank slate:
mvn clean site
This will recreate the documentation in the target/site directory. When we load the index.html file, we can see that the documentation now has a modern feel:
The project documentation with the Fluido skin.
But wait a moment: the links to the project reports (Dependencies, Plugins, etc.) that used to be on the left are now missing. We need to update our site descriptor to tell Maven to include them. Load up the site.xml file again, and add a <body> section as shown here:
This tells Maven that the body of our page should include two menus. There are three predefined Maven menus: “modules” (with links to the documentation for submodules of this project); “parent” (with a link to the parent project for this project); and “reports” (with links to the reports generated for our project. We can also add our own menus, as we will see in the next post in this series. For now, we will use the predefined modules and reports menus.
Once again, we save our site.xml file and run the mvn clean site command to regenerate our documentation. Now, when we load the index.html file, it looks like this:
The project menus are now restored.
Much better! We have now successfully updated our documentation to use the Bootstrap-based Fluido skin. In our next post, we will continue to enhance the documentation. Stay tuned!
Today, we will see how to use Java annotations in our source code to formalize references to software specifications. For example, here is how we might reference Joshua Bloch’s advice in “Effective Java” on using a Java enum to implement the Singleton pattern:
It’s a common situation: you write some code that implements part of a software specification, and you put in a quick comment that references it. Meanwhile, your coworkers are also putting in comments that reference the same specification. Eventually, the code comments begin to look like this:
publicvoid identifyFaceinImage(BufferedImage img) {
// Call the FaceMuncher API as shown in the spec
}
publicvoid drawBoxAroundFace(BufferedImage img) {
// Page 37 of the 4.0 specification says to draw
// a yellow box around the face
}
publicvoid showErrorMessage(String ms) {
// Section 6.5 of the specification says to
// draw the error message in a speech bubble
}
As you can see, the comments are written in various ways: some refer to page numbers in the specification, some refer to sections, and some do not refer to a particular location at all. The team could get together and decide on a common way to refer to the specification (e.g., “always refer to the section number and the draft version”), but there is no way to automatically enforce the style, and programmers new to the team must be taught the idiom. Wouldn’t it be nice if there were a way to formalize the references?
Annotations to the rescue!
We can use a Java annotation to solve our problem. An annotation is metadata that provides information about some Java source code. You have probably already used some of the built-in annotations, such as @Override to indicate that a method overrides a method in a superclass. Luckily, Java makes it very easy to implement our own annotations.
Let’s see how we might write an annotation to formalize references to Joshua Bloch’s “Effective Java: 2nd Edition.” The book has 78 items (e.g., “Item 10: Always override toString”) that are grouped into 10 chapters (not including the “Introduction” chapter). We would like to be able to add a formal reference to an item by referring to the chapter number and item number.
Start up your favorite Java IDE and create a file called EffectiveJava.java. Add the following code to it:
package com.softwareriot;
import java.lang.annotation.Documented;
public @Documented @interface EffectiveJava { int edition() default 2;
int chapter();
int item();
String comment() default"";
}
A Java annotation is defined using the @interface keyword. This particular file defines an annotation called EffectiveJava. It allows us to use @EffectiveJava as an annotation in our code.
The @Documented annotation is optional: if we include it, then our custom annotation will be included in any JavaDoc documentation that we create.
This particular annotation has four annotation type element declarations: edition, chapter, item, and comment. Two of the declarations have default values, which means that we do not have to include them when we use our annotation. For example, this annotation will compile successfully because the missing edition has a default value:
@EffectiveJava(chapter=2,item=1,
   comment="The edition is optional")
but this annotation will not compile because the missing item does not have a default value:
@EffectiveJava(edition=2,chapter=2,
   comment="The item declaration is missing")
We can use our annotation in our source code by importing the annotation and attaching it to a class or method:
It is easy to see how we might use an annotation to implement references to an internal company specification. We can also use custom annotations to reference calls to third party APIs: e.g., @TwitterAPI, @FacebookAPI, etc.
Conclusion
What are the advantages of using an annotation to reference a software specification? First, it provides a consistent means of referring to a specification throughout the source code. By providing methods without default values (such as the “chapter” and “item” methods in our example), we can ensure that software developers provide all of the necessary information needed to refer to the software specification. The consistent declaration also makes it easy to grep through source code to find references to the software specification.
Second, if we use the @Documented annotation when creating our custom annotation, we can see our references to the software specification in any JavaDoc documentation that we create.
Third, by formalizing the documentation using an annotation, we make it possible to write rules to check the annotations using PMD (see the previous Software Riot blog posts on PMD).
Finally, it is possible to write Java programs to locate the custom annotations in our code. For example, we might write a program to extract references to a software specification to identify portions of the spec that have not yet been implemented, or to generate a document showing how the software specification is implemented.
While everyone is waiting on today’s eclipse, let’s take a look at the Eclipse IDE and see how to create our own Java code template.
Software developers often find themselves writing the same boilerplate code over and over again. An alternative is to copy and paste the code from elsewhere and then edit it, but this can lead to subtle copy/paste errors. A better method is to have the IDE write most of the boilerplate code. Eclipse gives us this capability by providing a means for writing our own code templates.
Let’s imagine that we would like to write a template for generating the following Builder pattern.
public final class MyClass {
private final String firstName; private MyClass (Builder builder) {
this.firstName = builder.firstName;
}
/**
* Gets the firstName
* @return the firstName
*/
public String firstName () {
return this.firstName;
}
/**
* A Builder for creating a MyClass object
*/
public static final class Builder {
private String firstName;
public Builder() {
this.firstName = "";
}
/**
* Sets the value of the firstName
* @param firstName the firstName value
* @return this Builder instance
*/
public Builder firstName(final String firstName) {
this.firstName = firstName;
return this;
}
/**
* Builds a MyClass instance
* @return a new MyClass instance
*/
public MyClass build() {
returnnew MyClass(this);
}
}
}
That’s a lot of code, but there are only four pieces of information that are unique: the class name (MyClass}, the instance variable name (firstName) and type (String), and the default value for the instance variable (an empty string).
We can convert this code to an Eclipse template by replacing those four items with Eclipse template variables. A template variable is a unique name surrounded by a dollar sign and braces. For example, we can use a template variable called ${className} to represent the name of our class.
Let’s see what our code looks like when we replace the class name with ${className}, the instance variable name with ${instanceName}, the instance variable type with ${instanceType}, and the default value for the instance variable with ${instanceDefault}:
publicfinalclass ${className} {
privatefinal ${instanceType} ${instanceName};
private ${className} (Builder builder) {
this.${instanceName} = builder.${instanceName};
}
/**
* Gets the ${instanceName}
* @return the ${instanceName}
*/
public ${instanceType} ${instanceName} () {
returnthis.${instanceName};
}
/**
* A Builder for creating a ${className} object
*/
public static final class Builder {
private ${instanceType} ${instanceName};
public Builder() {
this.${instanceName} = ${instanceDefault};
}
/**
* Sets the value of the ${instanceName}
* @param ${instanceName} the ${instanceName} value
* @return this Builder instance
*/
public Builder ${instanceName}(final ${instanceType} ${instanceName}) {
this.${instanceName} = ${instanceName};
return this;
}
/**
* Builds a ${className} instance
* @return a new ${className} instance
*/
public ${className} build() {
returnnew ${className}(this);
}
}
}
Now, let’s see how to add this template into Eclipse. Start up the Eclipse IDE, and select the “Preferences…” item from the Eclipse menu to bring up the Preferences dialog. Next, select Java -> Editor -> Templates to expose the Templates pane.
The Templates dialog in Eclipse.
To create a new template, click on the “New…” button on the right side of the window. This will bring up the “New Template” dialog.
The “New Template” dialog in Eclipse.
Since we are creating a template for Java code, make sure that the Java context is selected. Next, we need to create a name for our template: this should be a short name that we will type into the IDE when we want to insert our template. Since we are creating a template for inserting an instance of the Builder pattern, we will use “bp” (for “(b)uilder (p)attern)”) as our name.
For the description, we will use “Creates a Java class and builder.”
Finally, we paste the text for our template into the Pattern field.
The “New Template” dialog with our template code.
Click on the OK button to save our template and return to the Preferences dialog. Click on OK to exit the Preferences dialog. We are now ready to use our template!
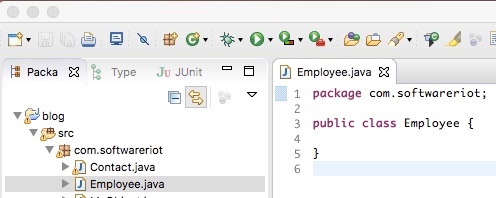
Let’s try it out. Create a new Java class called Employee:
A new “Employee” class.
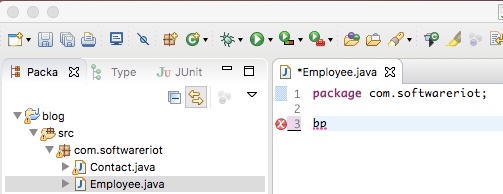
We would like to replace the default code with an instance of our template. Delete everything below the package declaration and type in the name of our template, “bp“:
Preparing to use our template.
Now, type CTRL+space to replace the “bp” text with our template. We should see the template code appear in the source code window, with “className” highlighted. Type in the text “Employee” and we should see all instances of ${className} replaced with the name “Employee.”
After changing ${className} to “Employee”.
Now, press TAB and we should see “instanceType” highlighted in the template. We’re going to insert an instance variable called “employeeName” with type “String“, so type “String” and press TAB again. Now, “instanceName” should be highlighted, so type “employeeName” and press TAB. We should see “instanceDefault” highlighted. This is the last template variable we need to fill in, so type in a default name (e.g., “John Doe”) and press RETURN. We now have a working version of our Employee class with an associated Builder class.
The Eclipse template system can be a great time saver – spend a few minutes to get familiar with it and you will become a more productive programmer!
If you’ve followed this week’s series on the static code analysis tool PMD, then you should be able to install it into the NetBeans IDE, run the standard PMD rules to detect problems with your Java code, and writesimplerules to detect your own company-specific code issues. Today, we will look at some helpful resources for a further study of PMD.
The PMD Applied book by Tom Copeland (the lead developer for PMD) is one of the best ways to learn more about PMD. The book explains how to install PMD in most common IDEs, use the copy/paste detector, integrate PMD into a Maven build, and write custom rules using XPath and Java.
The PMD web site maintains a page that lists products and books related to PMD.
If you would like to learn more about writing custom PMD rules using XPath, a great resource is the PMD rulesets page. Many of the rules are implemented using XPath expressions, and the expressions are listed in the documentation.
Today, we’re going to write some more custom rules for the static code analysis tool PMD. New developers at an organization have to “learn the ropes” when writing code (e.g., “all servlet calls must be logged using the ServletLogger.log() method’). A custom PMD rule can help teach this by identifying those issues in the IDE:
Using PMD to verify that servlet calls are logged.
We will look at two examples: verifying that servlet calls invoke a company-specific logger, and checking to see if some servlet values are entered as text strings instead of using predefined Java constants.
Example 1: Checking to see if servlet calls are logged
Let’s imagine that a typical servlet at our mythical YouGoogle company looks like this:
The company convention might be to log all servlet calls using a ServletLogger class with a log() method. This is the type of company specific information that a new developer, even one that has many years of experience in writing servlets, needs to learn when working at a new company. We would like to have the IDE check the code and flag servlet methods that do not call the logger. We can do this with PMD.
The first thing we do is to fire up the PMD Rule Designer (see the previous post in this series for details) and configure it to use XPath 2.0. Then we need to paste in a sample of our code that exhibits the problem we would like to detect. We are going to use the following sample code: it contains a doPost() method that invokes the logger; a doGet() method that does not invoke the logger; and a handleIt() method.
We would like to have our custom PMD rule check implementations of doPost() and doGet() to ensure that they call the ServletLogger.log() method. The doGet() method in this example should be flagged.
Paste this sample code into the “Source code” window and click on Go. The PMD Rule Designer will parse the code and display an Abstract Syntax Tree (AST).
The AST for our example code.
We need to write an XPath expression to find the doPost and doGet methods in the code and then check to see if those methods are missing a call to the servlet logger.
If we scroll through the AST, we can see that methods begin with a MethodDeclaration node, so we can use the following XPath expression to identify them:
//MethodDeclaration
Type that expression into the “XPath Query” field and click on Go.
Identifying the method declarations in our example code.
In the lower right corner, we can see that three ASTMethodDeclaration instances were found. If you click on each, the corresponding match in the “Source code” window will be highlighted. We can see that we have successfully located the methods in our example class.
The next step is to limit the methods that we found to include only the doPost and doGet methods. If we scroll through the AST, we can see that the method name is found in the MethodDeclarator node. We can update our XPath expression to find those nodes:
//MethodDeclaration/MethodDeclarator
If we click on Go, we should see that we still have three matches, but when you click on each, only the method names and arguments are highlighted instead of the entire method. Now click on one of the MethodDeclarator nodes in the AST and look at the properties below it:
Examining the MethodDeclarator AST node.
We can see that the Image attribute of the MethodDeclarator node has the method name (in this case, doPost). Let us update our XPath expression to check that the attribute is either doPost or doGet:
//MethodDeclaration/MethodDeclarator[@Image='doPost' or @Image='doGet']
Now, when we click on Go, only the doGet and doPost methods are highlighted. The handleIt method is no longer matched.
The next step is to find methods that do not call the ServletLogger.log() method. We can do this by determining how to match one of the method calls in the source code, and then counting them to see if the number of calls is zero. We scroll through the AST and find that the PrimaryPrefix node has a child called Name that has an attribute called Image that contains the text ‘ServletLogger.log‘, so let us use that. We can use this XPath expression to identify those method calls:
//PrimaryPrefix/Name[@Image='ServletLogger.log']
So, we now have an expression to identify methods called doPost or doGet, and we have an expression to identify statements that call ServletLogger.log. We need to combine those expressions. To do that, we restructure our first XPath expression slightly so that we can check multiple conditions when looking at a method:
//MethodDeclaration[
 ./MethodDeclarator[@Image='doPost' or @Image='doGet']
]
This expression says that when we find a MethodDeclaration, we begin there and check to see that there is a direct child called MethodDeclarator that defines a method called doPost or doGet. We can now add our second expression:
//MethodDeclaration[
 ./MethodDeclarator[@Image='doPost' or @Image='doGet']
and
 .//PrimaryPrefix/Name[@Image='ServletLogger.log']
]
If we click on Go, we can see that only the doPost method is matched because it contains a call to the servlet logger. We want to invert this so that the doGet method (which does NOT call the servlet logger) is matched instead. The easiest way to do that is by using the XPath not() function:
//MethodDeclaration[
 ./MethodDeclarator[@Image='doPost' or @Image='doGet']
and
 not(.//PrimaryPrefix/Name[@Image='ServletLogger.log'])
]
Now, clicking on Go will match the doGet method instead of the doPost method. We could also have used the XPath count() function:
//MethodDeclaration[
 ./MethodDeclarator[@Image='doPost' or @Image='doGet']
and
 count(.//PrimaryPrefix/Name[@Image='ServletLogger.log']) = 0
]
To use this rule in our IDE, we export it to a ruleset file (as shown in part three of this series) and import it into NetBeans. If we then examine a Java servlet, we can see that the doGet method is flagged.
Using PMD to verify that servlet calls are logged.
Example 2: checking to see that servlet constants are used
When configuring the response type from a servlet, many developers type in a text string like this:
It is easy to get the content type wrong when typing in a text string, especially for one of the more complicated return types. It is preferable to use the predefined constants in javax.ws.rs.core.MediaType:
We would like to flag the setContentType method in the doPost method that uses a hard coded string, but not the doGet method that uses a predefined constant. Fire up the PMD Rule Designer, set the XPath verison to 2.0, type in this sample code, and click on Go to generate an abstract syntax tree (AST).
If we scroll through the AST, we can see that the setContentType method call corresponds to a PrimaryExpression node. The PrimaryExpression has a child called PrimaryPrefix that has its own child node called Name with the text “resp.setContentType“.
The PrimaryExpression also has a child called PrimarySuffix that has a descendant for the argument to setContentType. When the argument is a “text/html” string, the descendant is a Literal node, but when the argument is a MediaType.TEXT_HTML constant, the descendant is a Name node. So, we need to identify calls to the setContentType method that contain a Literal.
To identify the PrimaryExpression nodes, we can use this XPath expression:
//PrimaryExpression
When we click on Go, we see that four matches are found in our example code. We want to narrow this down to PrimaryExpression nodes that have a PrimaryPrefix child with a Name child. We alter our XPath expression:
When we click on Go, we see that we are down to three matches. We only want to see method calls to setContentType, so we use the XPath ends-with() function:
Clicking on Go reveals that we are now matching only the two lines that invoke the setContentType method. Now, we want to identify those calls that contain a Literal argument, so we add a second expression:
//PrimaryExpression[
   ends-with(./PrimaryPrefix/Name/@Image, 'setContentType')
and
   ./PrimarySuffix//Literal
]
We click on Go, we see that only the method call in doPost that has a hard coded string value is flagged. We export this rule to our ruleset file, import it into NetBeans, and try it out:
Catching hard coded arguments to setContentType.
Very nice!
We could further improve on this rule (e.g., by only checking classes that have the @WebServlet annotation, etc.), but that is left as an exercise for the reader.
In our next post, we will wrap up our discussion of PMD. Stay tuned!